Re-reading reading: bonus round

Actually, bonus round and afterthought.

First, the afterthought. In a recent post for The New Yorker taking a second look at data about American reading habits, I wrote that “there’s a little bit of good news: the average American reader spent 1.39 hours reading in 2003, rising to 1.48 hours in 2016.” But I’m not so sure now that that’s good news. I imagined a bulwark of readers who were redoubling their devotion to literature in a time of crisis, but another explanation of the surge occurs to me. Maybe we’ve lost the fair-weather, lightweight readers, and all that’s left is a core who have always spent serious time on reading.

Now the bonus round. One of the graphs of reading habits that I made got left on the cutting-room floor, because it seemed to require more explanation than it offered enlightenment. But here on my personal blog, I’m free to bore you a little if I want to. So here we go . . .

In my post, I parsed the reading habits of Americans by age. But because the American Time Use Survey, the source for my data, has now lasted more than a decade, it’s also possible to follow the progress of age cohorts—that is, to compare the reading habits of people who were 25 to 34 years old between 2003 and 2006 with those of people who were 35 to 44 years old between 2013 and 2016, and so on. I did so with five cohorts, using averages of the data from 2003 to 2006 and from 2013 to 2016, with the following dispiriting results:

The youngest Americans in this graph, born in the 1980s, managed to increase their reading time a little over the course of the decade, but not by very much; it’s probably another case of what I refer to in my post as a dead-cat bounce. Every other age cohort read less at the end of the decade, except for the oldest, representing people born in the 1940s. That result may be untrustworthy, however, because my averages compare the 55-64-year-olds of 2003 to 2006 with those who were over 65 between 2013 and 2016, so there are late-septuagenarians, octogenarians, and nonagenarians in the mix, avidly reading and skewing the turquoise line higher than it deservedly should go.

Keep in mind that this graph is a little kludgier than the ones presented in and linked to in the original post (that’s why it got left on the cutting-room floor; sharp eyes will have noticed, for example, that the age cohorts that I’m comparing here overlap in birth years at the edges), but I think the overall pattern is suggestive enough for a blog on teh internet’s peripheries.

Trends in reading

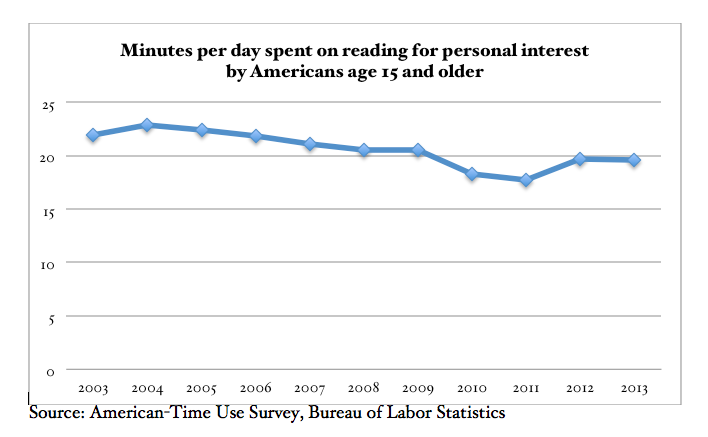
Minutes per day spent on reading for pleasure by Americans age 15 or older

A few weeks ago, I started writing “The Disenchantment of Literature in the Age of the Hit Counter,” a talk that I’m going to deliver at Reed College on March 30 and at the University of Portland on March 31. I found myself wondering whether there was a way to get a quick update of some of the statistics on literacy and reading in America that I collected in 2007, when I wrote an article called “Twilight of the Books” for The New Yorker, and I turned to the American Time-Use Survey (ATUS), which I remembered as one of the most solid sets of data, least subject to the very old-fashioned problem of respondents who lie and say they read more than they actually do. ATUS began in 2003, and it now has a decade of data.

The result is the chart above. In order to compile it, I had to do some arithmetic, which may not be entirely bulletproof, so let me explain. For some reason, in 2003 ATUS reported separate results for time spent reading by men and time spent reading by women, but didn’t report an average for the general population, so to come up with a single number, I weighted those results by what seems to have been the gender balance in America that year, 0.51 men to 0.49 women. In later years, ATUS reported separately time spent reading on weekdays and time spent reading on weekends and holidays, so to get a single average in those years I weighted the results by the ratio of 0.7 weekdays to 0.3 weekends and holidays. (I wondered whether ATUS was properly measuring reading on the internet, so I looked up ATUS’s coding rules for computer activity: “Code the activity the respondent did as the primary activity. For example, if the respondent used the computer to search for work, code as Job Search and Interviewing.” Presumably this means that if the respondent was using the computer to read, the time would be coded as reading, or rather, Leisure/Reading for Personal Interest.)

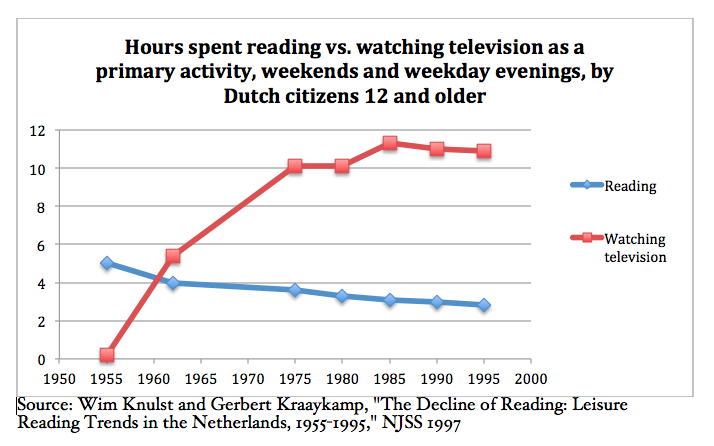
As you can see, what seems to be happening is a very slow, stately sinking. This is entirely consonant with a Dutch time-use study, much longer term, that tracked the time spent reading in the Netherlands for the first forty years after the introduction of television. I don’t know of an equivalent American study, but I imagine that the pattern in America resembled the one in the graph below.

Hours spent reading vs. watching television as a primary activity, weekends and weekday evenings, by Dutch citizens 12 and older

A retrospective glance

The New Yorker, as you may have heard, has redesigned its website, and is making all articles published since 2007 free, for the summer, in hopes of addicting you as a reader. Once you’re hooked, they’ll winch up the drawbridge, and you’ll have to pay, pay, pay. But for the moment let’s not think about either the metaphor I just mixed or its consequences, shall we?

A self-publicist’s work is never done, and it seemed to behoove me to take advantage of the occasion. So I googled myself. It turns out that I’ve been writing for the New Yorker since 2005 and that ten articles of mine have appeared in the print magazine over the years. All seem to be on the free side of the paywall as of this writing (though a glitch appears to have put several of the early articles almost entirely into italics). Enjoy!

“Rail-Splitting,” 7 November 2005: Was Lincoln depressed? Was he a team player?
“The Terror Last Time,” 13 March 2006: How much evidence did you need to hang a terrorist in 1887?
“Surveillance Society,” 11 September 2006: In the 1930s, a group of British intellectuals tried to record the texture of everyday life
“Bad Precedent,” 29 January 2007: Andrew Jackson declares martial law
“There She Blew,” 23 July 2007: The history of whaling
“Twilight of the Books,” 24 December 2007: This is your brain on reading
“There Was Blood,” 19 January 2009: A fossil-fueled massacre
“Bootylicious,” 7 September 2009: The economics of piracy
“It Happened One Decade,” 21 September 2009: The books and movies that buoyed America during the Great Depression
“Tea and Antipathy,” 20 December 2010: Was the Tea Party such a good idea the first time around?
Unfortunate Events, 22 October 2012: What was the War of 1812 even about?
“Four Legs Good,” 28 October 2013: Jack London goes to the dogs
“The Red and the Scarlet,” 30 June 2014: Where the pursuit of experience took Stephen Crane

Flip you for it

If the recession lasts another year, the New York Times will probably survive. If it lasts two more years, analysts aren't sure. That's one way of reading the latest reporting about the paper's future from the New York Times itself. By borrowing $250 million in January from a Mexican billionaire at what it calls "punishing terms," the paper, according to analysts, "has positioned itself well to ride out another year of recession, maybe two." The trouble is that the analysts also say that the Times accepted the punishing terms because they expect they will only be able to get even worse loan offers as the recession progresses. "Maybe two" years isn't a comfortingly distant horizon.

Another official revelation in the article: Somewhat morbidly, the longterm health of the New York Times is now understood by those who guide it to be conditional on the death of other newspapers across America. "There is a feeling among analysts that there is merit to the last-man-standing strategy," the Times reports. In 2010 or 2011, one analyst suggests, "there could be dramatically fewer newspapers," and absent those competitors, the Times should be able to prosper. To me this sounds a little bit like saying that in the event of a plague, there will be proportionally speaking a lot of canned food left over for survivors.